Statistics and Probability
Data Collection
Level of Measurement: Nominal, Ordinal, Interval or Ratio
1. Write the right option choosing among: Nominal, Ordinal, Interval or Ratio.
- High school men soccer players classified by their athletic ability: Superior, Average, Above average.
- Baking temperatures for various main dishes: 350, 400, 325, 250, 300
- The colours of crayons in a 24-crayon box.
- Social security numbers.
- Incomes measured in dollars
- A satisfaction survey of a social website by number: 1 very satisfied, 2 somewhat satisfied, 3 not satisfied.
- Political outlook: extreme left, left-of-center, right-of-center, extreme right.
- Time of day on an analog watch.
- The distance in miles to the closest grocery store.
- The dates 1066, 1492, 1644, 1947, 1944.
- The heights of 21 65 year-old women.
- Common letter grades A, B, C, D, F.
(Source: Solved: What type of measure scale is being used? Nominal, ordi... | Chegg.com)
2. Given the following data, answer the questions:
|
Day |
Celsius |
Fahrenheit |
|
1 |
6 |
42.8 |
|
2 |
9 |
48.2 |
|
3 |
15 |
59 |
2.1. The data collection is measurable by nominal or ordinal scale?
a. Nominal
b. Ordinal
2.2. The data collection is an interval or report scale?
a. Interval
b. Report scale
Organize Data: Absolute, Relative and Cumulative Frequencies, Frequency Table
3. Given the following data collection:
|
5 |
6 |
3 |
4 |
7 |
|
2 |
0 |
3 |
3 |
4 |
|
5 |
1 |
3 |
4 |
3 |
3.1. Complete the frequency table:
|
Number |
Frequency |
|
a. 0 |
|
|
b. 1 |
|
|
c. 2 |
|
|
d. 3 |
|
|
e. 4 |
|
|
f. 5 |
|
|
g. 6 |
|
|
h. 7 |
|
|
i. Total |
|
3.2. Calculate
the relative frequency of 0 (write the correct answer):
3.3. Calculate
the relative cumulative frequency of 1 (write the correct answer):
Data Set Characteristics
Mode, Mean, Median, Quartiles, Measure of Center, Measure of Spread
1. Given the following data set:
|
Player |
Height |
|
Player 1 |
1,96 |
|
Player2 |
1,97 |
|
Player 3 |
1,98 |
|
Player 4 |
2,01 |
|
Player 5 |
2,01 |
1.1. Calculate the median (write the correct answer):
1.2. Calculate the mode (write the correct answer):
1.3. Calculate the quartiles (write the correct
answer):
2. Given the data set 1,1,2,3,5,81,1,2,3,5,8 – answer the following questions:
2.1. What is the range?
2.2. What is the variance?
(Source: Exercises - Measures of Center and Spread (emory.edu))
Graphical Representation of Data
Graphical Representations, Pie Chart, Bar Chart, Comparing Two Sets of Data
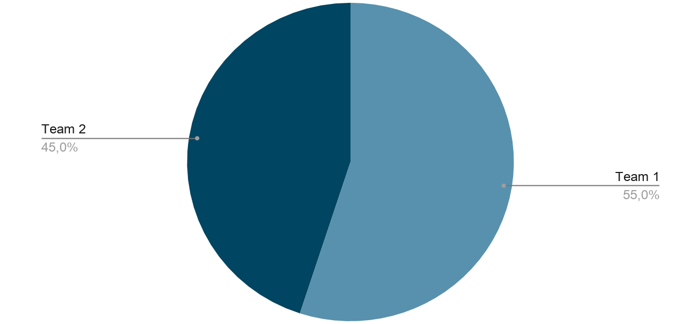
1. Given the data set and the pie chart below, answer to the following questions:
Team basket 1
|
Player |
Height |
|
1 |
1,96 |
|
2 |
1,97 |
|
3 |
1,98 |
|
4 |
2,01 |
|
5 |
2,01 |
Team basket 2
|
Player |
Height |
|
1 |
1,56 |
|
2 |
1,59 |
|
3 |
1,60 |
|
4 |
1,62 |
|
5 |
1,75 |
(Source: internal)
1.1. Which is the tallest team? (Write the correct answer)
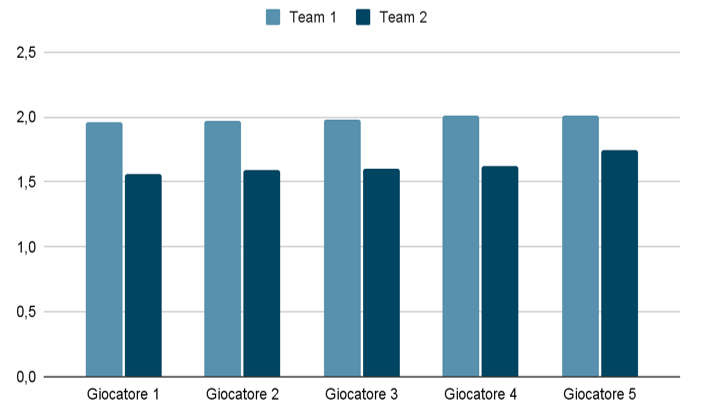
2.Given the bar chart below, answer the following question:
(Source: Internal)
2.1. Which player of each team is the tallest?
Team 2:
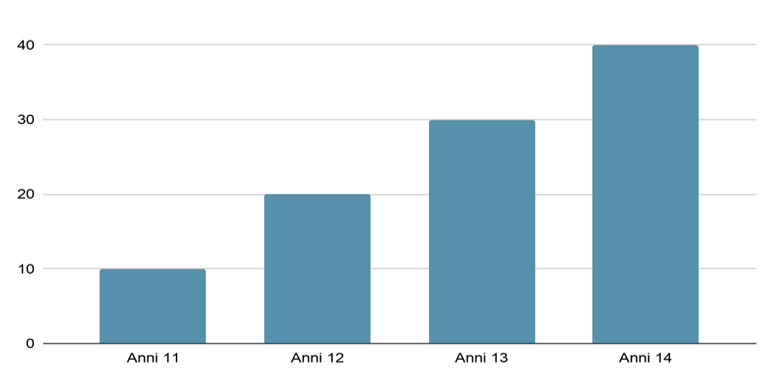
3.The following bar chart is a representation of the age of the students in a specific school. Answer the following question:
(Source: internal)
3.1. How many students does the school have?
a. 100
b. 110
c. 90
d. 12
Probability
Sample Space
1. What is the sample space for choosing an odd number from 1 to 11 at random?
- 1,2,3,4,5,6,7,8,9,10,11
- {1,2,3,4,5,6,7,8,9,10,11}
- 1,3,4,7,9,11}
- None of the above
2. What is the sample space for choosing a prime number less than 15 at random?
- {2,3,5,7,11,13,15
- {2,3,5,7,11,13}
- {2,3,5,7,9,11,13}
- All of the above
3. What is the sample space for choosing 1 jelly bean at random from a jar containing 5 red, 7 blue and 2 green jelly beans?
- 5 red, 7 blue, 2 green
- Red, blue, green
- None of the above
4. What is the sample space for choosing 1 letter at random from 5 vowels?
- {a, e, I, o, u}
- {v, o, w, e, l}
- {1, 2, 3, 4, 5}
- None of the above
(Source: Sample Spaces | Math Goodies)
Concept of Complementary, Independent, Mutually Exclusive and Exhaustive Events
5. What are mutually exclusive events?
- Events that add up at 100% Events that can happen at the same time
- Events that cannot happen at the same time
6. Tossing a coin and landing on head and tails
- Mutually exclusive
- Not mutually exclusive
7. Rolling a 6 or an even number
- Mutually exclusive
- Not mutually exclusive
8. Drawing a red or an ace from a deck of cards
- Mutually exclusive
- Not mutually exclusive
(Source: Mutually exclusive and complementary events (Only) - Quizizz)
9. Write the correct answer to the following questions:
9.1. There are 26 tiles of which 5 represent vowels in a game of scrabble. Two tiles are drawn so that the first is replaced before the second is drawn. What is the probability of not getting a consonant both the times?
9.2. A selection of balls numbered 1 to 10 is in a bucket. What is the complement to select a ball having number multiple of 3?
9.3. Drawing a king and drawing a spade from a standard deck of cards. Are these events mutually exclusive? (Type yes or no)
9.4. A spinner has the six letters F, I, G, U, R and E written on each of its six equal segments. Tom tosses a coin and spins the spinner. Are these two events dependent or independent?
9.5. There are 3 pens and 5 pencils in a box. If a student selects two of them at random, what is the probability of selecting a pencil and then a pen?
(Source: Math Worksheets Center - Worksheet Viewer Page)
Venn Diagram
10. Out of forty students, 14 are taking English Composition and 29 are
taking Chemistry. Answer the following questions:
10.1. If five students are in both classes, how many students are in neither class?
a. 2
b. 1
c. 3
10.2. How many are in either class?
a. 40
b. 41
c. 38
10.3. What is the probability that a randomly-chosen student from this group is taking only the Chemistry class?
a. 70%
b. 60%
c. 65%
(Source: Venn Diagrams: Exercises | Purplemath)